 —
—
 Reset all filters
ALTEA
ALTEA is a detector on the ISS which has been deployed in the US Lab in the ALTEA-Survey (ALTEA-3D) configuration, and in the Columbus module in the ALTEA-Shield (ALTEA-Flat) configuration.Attributes
Trajectory: LEOSpacecraft: ISS
Modules: US Lab, Columbus
Cadence (time resolution) of the currently available data: 60 seconds
References
- Narici, L., Casolino, M., Di Fino, L., Larosa, M., Picozza, P., & Zaconte, V. (2015). Radiation survey in the international space station. Journal of Space Weather and Space Climate, 5, A37. https://doi.org/10.1051/swsc/2015037
- Narici, L., Berger, T., Burmeister, S., Di Fino, L., Rizzo, A., Matthiä, D., & Reitz, G. (2017). Exploiting different active silicon detectors in the International Space Station: ALTEA and DOSTEL galactic cosmic radiation (GCR) measurements. Journal of Space Weather and Space Climate, 7, A18. https://doi.org/10.1051/swsc/2017016
- Zeitlin, C., Narici, L., Rios, R. R., Rizzo, A., Stoffle, N., Hassler, D. M., ... & Spence, H. E. (2019). Comparisons of high-linear energy transfer spectra on the ISS and in deep space. Space Weather, 17(3), 396-418. https://doi.org/10.1029/2018SW002103
Overview
ALTEA is a detector system composed of six identical silicon strip telescopes, each able to measure the energy loss of all ions most relevant for radiation protection in space (Z = 1-26). For protons and helium ions, respectively, the energy ranges are 25-45 Mev and 25-250 MeV/n. ALTEA also measures the trajectory of each ion, while using a statistical method to estimate the incident ion charge and energy. Typically flux, LET (Linear Energy Transfer) rate, absorbed dose rate, Q (quality factor), dose equivalent rate with a time resolution of better than 1 second can be provided. Particle by particle data is also available, as well as LET spectra. In conjunction with orbital data, separation among the important geographical or magnetic regions can be made.
Detector configuration
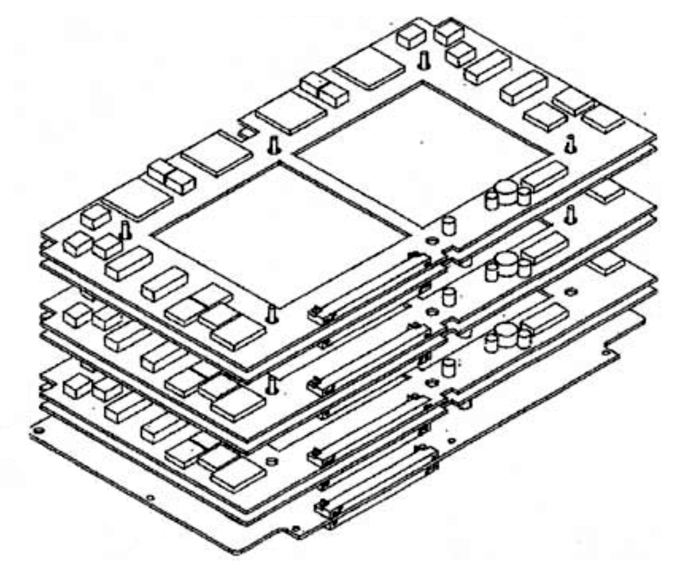
The ALTEA system is composed of 6 identical Silicon Detector Units (SDU), and one electronic Data Acquisition Unit (DAU). Each SDU is a six-plane particle telescope, with each plane composed of two 8×8 cm2 silicon wafers, 380 μm thick, placed side by side on an aluminum support and spaced 5.5 mm apart, for a total surface of 8×16.55 cm2. Each silicon wafer is divided into 32 strips, with a pitch of 2.5 mm. Plane orientation alternates between X and Y directions. The distance between an X plane and the adjacent Y plane is 3.75 mm, while the distance between each XY pair is 37.5 mm. The hits in two consecutive planes provide the position of the particle in the X-Y plane, while hits in pairs of planes provide the Z. The outer box of each SDU is made of 1.3 mm thick aluminum and the whole structure results in a double-ended geometrical factor of 230 cm2·sr. The field of view reaches 66.8° on the diagonal.
The front-end electronics are located around each double wafer, while at the bottom of the silicon planes, a 7th parallel plane with the same dimensions hosts the Read-Out Electronics board (ROE). (The figure shows the six double wafers plus electronics and—at the bottom—the ROE). The average equivalent thickness of the ROE is estimated to be 0.8 μm of glass + 0.8 μm of copper + 1 μm of silicon.
Detector electronics: triggers
Energy depositions above the threshold in each silicon plane are read if a self-trigger is issued in one of the SDUs. The threshold is 2.9 keV/μm. Energy released in the silicon wafers can be read up to about 690 KeV/μm before saturation. A self-trigger in a SDU is issued if a deposition above the threshold is read on all the X planes.
ALTEA is therefore able to measure ions from H to Mo (molybdenum only at relativistic energies). The figure below shows the energy acceptance for the ions most relevant for space radiation effects on biological organisms (H → Fe).
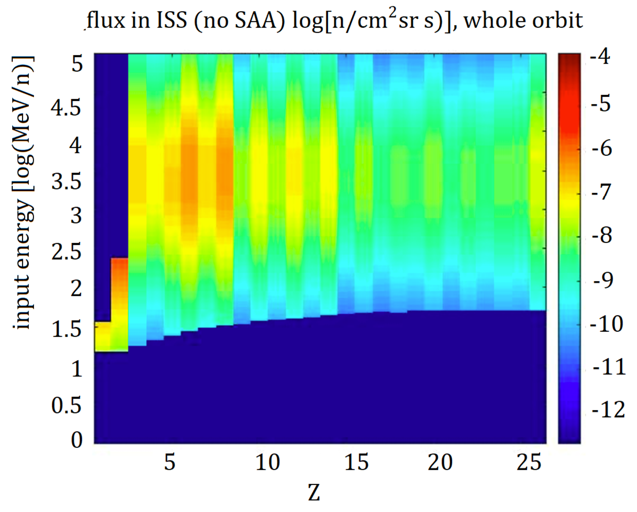
The dark blue areas are the charge-energy regions which are not measured. The flux is from a GCR model (CREME96) which indicates where the GCR flux is most abundant. Note that the lower blue area corresponds to the ions that do not manage to traverse the whole detector (and to a region scarcely populated by the GCR), while the left top blue area corresponds to the fast light ions delivering below-threshold energies. (Protons are measured between 25 MeV and 45 MeV, He ions between 25 MeV/n and 250 MeV/n.)
Configurations
Three different configurations have been used during ALTEA measurements.- Helmet: The six SDUs were mounted on a helmet shaped holder. The system could be mounted on the astronaut's head to measure the radiation impinging in the brain. The system has also been rack-mounted to measure radiation in the US Lab.
- 3D (deployed in US Lab): The detectors where mounted on a holder in three orthogonal directions (2 SDUs in each direction).
- Flat (deployed in Columbus): Three (note: only three) of the six SDUs where mounted flat in a planar configuration. In this configuration two of the three SDUs were sandwiched by additional shielding material to investigate shielding efficacy.
Positions
ALTEA measured radiation in the ISS during the period of 2006—2012. During this period, it was positioned in a number of locations in the US Lab (Helmet and ALTEA-3D configurations) and in one location in Columbus (ALTEA-Flat configuration only, for evaluation of shielding). The positions are listed in the table below.
| Configuration | Start date | End date | Position name | Module | Location |
| Helmet | 2006 (data not currently in RadLab) | US Lab | LAB1P1 | ||
| Helmet | 2007 (data not currently in RadLab) | US Lab | LAB1P2 | ||
| Helmet | 2009 (data not currently in RadLab) | US Lab | LAB1P1 | ||
| Helmet | 2010 (data not currently in RadLab) | US Lab | LAB1O2 | ||
| ALTEA-3D | 2010/09/20 | 2010/10/04 | P1 | US Lab | LAB1S1 |
| ALTEA-3D | 2010/10/15 | 2010/11/30 | P2 | US Lab | LAB1O2 |
| ALTEA-3D | 2011/04/24 | 2011/07/22 | P3 | US Lab | LAB1P4 |
| ALTEA-3D | 2011/07/23 | 2012/06/07 | P4 | US Lab | LAB1S6 |
| ALTEA-Flat | 2012 (data not currently in RadLab) | P5 | Columbus | COLER3 | |
